The stats helper monkeys at WordPress.com mulled over how this blog did in 2010, and here’s a high level summary of its overall blog health:

The Blog-Health-o-Meter™ reads Wow.
Crunchy numbers
About 3 million people visit the Taj Mahal every year. This blog was viewed about 47,000 times in 2010. If it were the Taj Mahal, it would take about 6 days for that many people to see it.
In 2010, there were 10 new posts, growing the total archive of this blog to 276 posts. There was 1 picture uploaded, taking a total of 211kb.
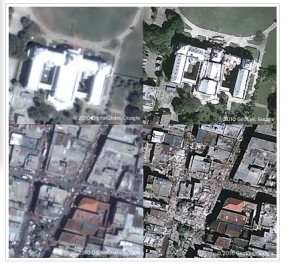
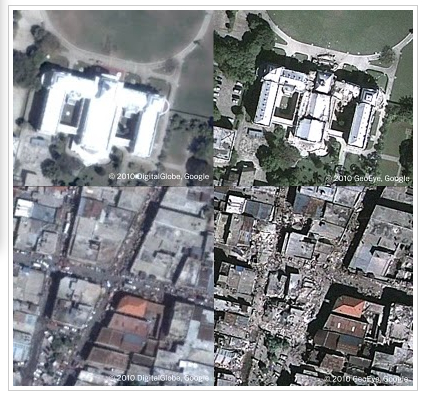
The busiest day of the year was January 14th with 632 views. The most popular post that day was Google Earth Before and After images of Haiti Quake.
Where did they come from?
The top referring sites in 2010 were uwsp.edu, google-latlong.blogspot.com, socioecohistory.wordpress.com, search.conduit.com, and freesexmovie.irwanaf.com.
Some visitors came searching, mostly for physical environment, ocean food chain, food chain, ocean food web, and marine biome food web.
Attractions in 2010
These are the posts and pages that got the most views in 2010.
1
Google Earth Before and After images of Haiti Quake January 2010
2
Crucial Marine Food Chain Link Withers December 2006
3
Exploring Effects of the Haitian Earthquake January 2010
4
Vital Ocean ‘Carbon Sink’ Nearly Full May 2007
5
Catastrophic earthquake overdue for Los Angeles July 2008


You must be logged in to post a comment.